ICBF HerdPlus have now added more sub-Indexes in the EBI to the Genomic Evaluation Results profile. Previously only the Milk, Fertility, Beef and Calving Sub- indexes were available on the profile. The four additional Sub-indexes are as follows:
- Maintenance SI (Cow liveweight PTA).
- Management SI (Milking Time PTA and Milking Temperament PTA).
- Health SI (SCC PTA, Lameness PTA, Mastitis PTA, Tuberculosis PTA, and Liver fluke PTA).
- Carbon SI
In addition to this, the conformation traits have also been added to profile. All the conformation traits are now available on the PDF profile download. The new trait “Age at Slaughter” in the beef sub-index has also been added to the profile.
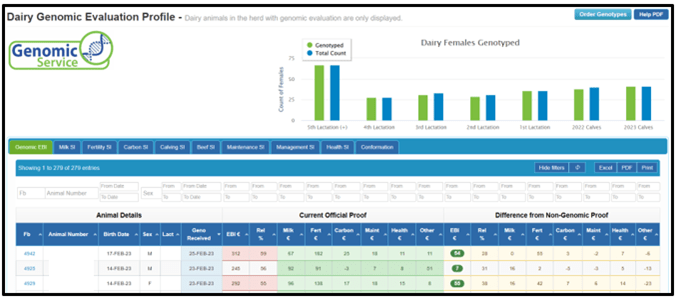
The addition of all the traits in the EBI will make further information more accessible and easier for farmers to view dairy genomic evaluations on animals. This will help farmers make more informed management decisions. The genomic results profile displays an animal’s current official genomic proof and the difference from the non-genomic proof. The Difference from the non-genomic proof calculates the difference between the genomic EBI and the non-genomic proof in the same evaluation. This is done across all the traits in the EBI and the conformation traits.
Some useful benefits to the farmer when using this Profile screen include:
- Easy to identify the best heifers to breed as replacements.
- View all dairy genomic evaluations results in your herd.
- Access a specific animal result quickly and easily.
- No longer a necessity to store paper reports.
- Animals can be sorted and filtered in this profile.
- Profile can be downloaded to Excel and PDF formats.
- Click on the blue figures to view even more information on the animal. E.g., Lactation Summary, Fertility, Ancestry data etc.
Below is a step-by-step guide on how to access this profile.
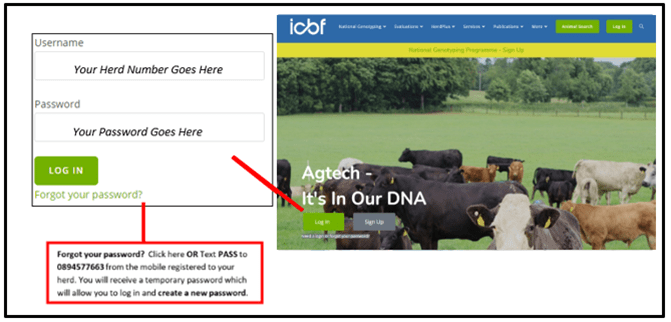
- Go to www.icbf.com and login to your HerdPlus account using your username and password.
- Under the ‘View Profiles’ drop down, select ‘Dairy Genomics’
The screenshot above illustrates the screen, and what the user will see. Genomic results of animals will appear on this screen when genomic evaluations are published.
Click on the tabs to see an animal’s genomic evaluation result for each trait in the sub- index.
Note: All the columns can be filtered to analyse genomic results more closely. The data in the columns can also be sorted into ascending or descending order by clicking on the column heading. The profile can be downloaded to excel and PDF format.
Genomic Results for all traits for a group of animals being available in a profile format saves time and effort in comparison to going through pages of genomic evaluation reports to identify the best heifers to breed as replacements.
If you have any questions, or if you have any comments or feedback, please contact HerdPlus on 023-8820452 or email [email protected].


